How Should We Interpret the COVID-Related Reduction in Health Spending?
April 05, 2021
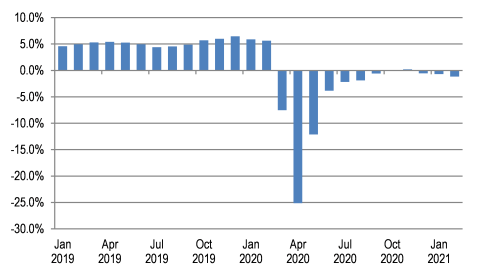
The rapid decline and subsequent rebound in the use of health care services and associated health spending in the U.S. as a result of the COVID-19 pandemic has been well documented. Personal health care (PHC) spending (spending on health care goods and services, which accounts for 84% of national health spending) has recovered in recent months to levels that have hovered slightly below those observed in the previous year (Exhibit 1)1. While this represents a significant increase in spending from the trough observed in April 2020, spending on PHC from September 2020 through February 2021 has averaged nearly 0.5% below the same period the year before, suggesting that the pace of the recovery in spending has stalled, at least temporarily.
Exhibit 1. Year-over-Year Growth Rates in Personal Health Care Spending
However, constant year-over-year growth rates do not necessarily mean health spending levels in February 2021 are the same as September 2020; in fact, because spending was also increasing in the prior 5-month comparison period, PHC spending has increased $5.8 billion since September 2020. For just the most recent five months, health spending growth is quite similar to what it was before the pandemic. Beginning in October 2020, after year-over-year growth rates appear to have calmed somewhat from the one-time pandemic impacts, PHC spending has grown by 2.2%. For comparison, during the same five-month period in the previous year, PHC spending grew by 2.8%. In other words, while health spending growth has leveled off in recent months, current growth rates are similar to pre-pandemic rates, while spending levels have nearly reached pre-pandemic levels. The result is a one-time downward shift in spending, with a possible subsequent continuation of spending growth at or near historical rates.
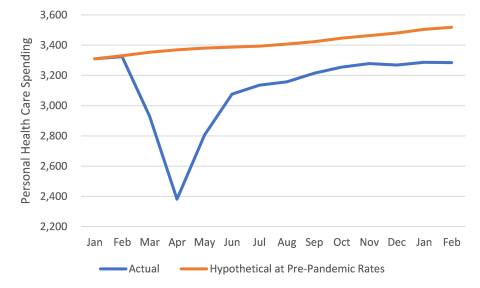
Exhibit 2 illustrates an estimate of the expenditures foregone during the pandemic to date. It shows the actual PHC spending trajectory from January 2020 through February 2021 (in seasonally adjusted annual rates) and compares it with the trajectory that would have occurred if month-over-month growth rates observed from February 2019 through February 2020 were realized from February 2020 through February 2021. The difference between the two curves represents $338 billion of additional PHC expenditures that might have been realized in the absence of the pandemic. Included in this $338 billion would have been spending of $149 billion on hospital care, $111 billion on physician and clinical services, $46 billion on dental care, and smaller amounts for the other components of PHC. (The spending growth trajectories for the individual components of PHC vary somewhat from that summarized in Exhibit 1.) As we have noted previously, some of this spending gap has likely been mediated by direct federal government support to health care providers during the pandemic through vehicles such as the CARES Act, of which only a portion is likely captured in these data. In fact, many recent reports of 2020 hospital finances have shown declines in operating revenue are being offset by federal relief funds.
Exhibit 2. Actual and Hypothetical PHC Spending Trajectory, Jan 2020 – Feb 2021
Discussion early in the pandemic hypothesized that pent-up demand for health care goods and services might cause a post-pandemic surge in spending. While it may be too early to observe such a surge, these preliminary data suggest that at least some of the care that was deferred early in the pandemic will never be delivered. Under other circumstances, the resulting billions of dollars in reduced expenditures would have been celebrated as a significant saving in health care costs. But there is evidence that a substantial portion of those “savings” were the result of foregone needed care because of temporary suspension of some services, patients’ fear of exposure, and loss of health insurance with loss of employment caused by the COVID-induced recession. Moreover, this period of recovery in health spending has also been one of above average health care price growth, indicating that the cost of care and not necessarily the increased use of services benefiting patients is driving some of the recovery. As a result, the return toward pre-pandemic spending growth does not necessarily mean that the need for care is being met, while again raising a previous concern that health spending growth may not be sustainable in the long run.
1 Data in this blog are based on our Health Sector Economic Indicators framework, which provides monthly estimates of national health spending, employment, and prices. The monthly spending estimates sum exactly to the government’s National Health Expenditure Accounts (NHEA) values through 2019 and are designed to predict the NHEA values for 2020 and 2021 as closely as possible. Our 2020 and 2021 estimates for most categories of personal health care are based on the US Bureau of Economic Analysis (BEA) National Income and Product Accounts, and incorporate BEA’s data from its March 26, 2021 release.