Perspective: Nursing Home Staffing Trends and the Covid-19 Pandemic
Background
The Covid-19 pandemic had a major impact on nursing homes, including a large number of deaths from Covid and a significant decline in both the number of nursing home residents and nursing home staff. These declines have also been accompanied by a reduction in the number of nursing homes operating in the country. While overall declines in staff and residents have partly recovered since the end of the pandemic, understaffing in U.S. nursing homes remains a significant concern.
Recognition of nursing home understaffing has led the Centers for Medicare & Medicaid Services (CMS) to propose new minimum staffing standards for long-term care facilities. The proposed rule was published for public comment in the Federal Register on September 6, 2023. It would require a daily minimum of 2.45 hours of nurse aide (NA) time per resident (referred to as hours per resident day, or HPRD) and 0.55 daily hours of time by registered nurses (RNs) per resident. These standards are lower than standards previously recommended by CMS (4.1 direct care nursing HPRD, including 0.75 RN HPRD).
The recent changes in nursing home staffing, census, and the number of nursing homes operating in the U.S. raises the question of how these changes have interacted to affect the extent of understaffing during and after the pandemic and the extent to which the proposed staffing standards are currently being met. We address this question through a review of trends in nursing home resident census and staffing levels from before the start of the pandemic through the end of 2022.
Methods
The principal sources of data for this analysis are the Payroll-Based Journal (PBJ) Public Use Files for nursing staff, submitted quarterly by nursing homes in the U.S. and published by CMS. These files provide detailed information on staffing for every nursing home in the country. Our analysis is based on quarterly summaries of these data prepared by the nonprofit Long Term Care Community Coalition. For each quarter from the first quarter of 2019 (2019Q1) through 2022Q4, we extracted or computed the following statistics from these summaries:
- The total number of nursing home facilities reporting,
- The total census of patients in all these nursing homes,
- The average census per facility,
- The average NA HPRD,
- The average RN HPRD, computed in two ways, as discussed below,
- The percent of facilities whose NA HPRD exceeds 2.45,
- The percent of facilities whose RN HPRD exceeds 0.55 (again computed in two ways),
- The distribution across nursing homes of the magnitude of NA HPRD shortages (computed for 2022Q4 only), and
- The distribution across nursing homes of the magnitude of RN HPRD shortages (for 2022Q4 only).
The data include both employed and contracted staff. These statistics are supplemented with information on nursing home employment from Altarum’s Health Sector Economic Indicators (HSEI) Labor Brief, allowing estimation of the following additional statistics:
- The total number of employees in nursing homes
- The number of employees per nursing home resident
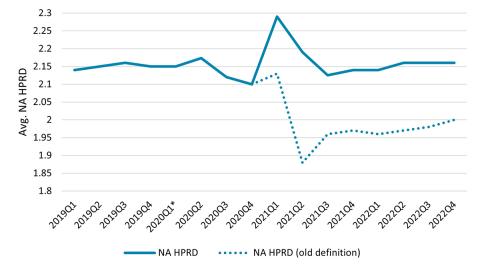
A few issues with the PBJ data required special treatment. First, not all facilities reported staffing data for 2020Q1 because of suspended reporting requirements due to the Covid-19 pandemic, resulting in reports from fewer facilities during that quarter. Census counts for that quarter are not included in our presented results. Second, starting in 2021Q1, the definition used to compute NA HPRD changed to add medication aides and nurse aides in training to the count of certified nursing assistants. Beginning with that quarter, we show HPRD values using the old definition as well as the new one to allow consistent comparisons with previous quarters.
Finally, the computation of RN HPRD levels can potentially incorporate two different types of nursing staff, direct care nursing staff and administrative staff, leading to different findings regarding the proposed staffing thresholds. On the one hand, the Supplementary Information portion of the CMS submission notes that their proposed policies include “minimum HPRD standards for direct care by nursing staff,” and that “our proposed definition [of direct care worker] does not include administrators (or staff whose primary function is administrative or supervisory).” The submission also indicates that “we are more closely aligning our proposed definition of direct care worker with the definition of direct care worker for a similar provision focused on HCBS in the Ensuring Access to Medicaid Services proposed rule.” That proposed rule states that “our definition of direct care worker is intended to exclude nurses in supervisory or administrative roles who are not directly providing nursing services to people receiving HCBS.” This suggests that we should exclude supervisory RNs from our reporting of RN HPRD levels.
On the other hand, the text of the proposed rule itself refers only to an RN staffing standard, without specifying that supervisory staff should be excluded. Furthermore, other researchers who have analyzed the proposed rule appear to include supervisory RNs in their assessment of the staffing standards. Given the uncertainty in these definitions, we report RN HPRD levels both with and without supervisory nurses, which we refer to as “RN total HPRD” and “RN direct care HPRD,” respectively.
Results
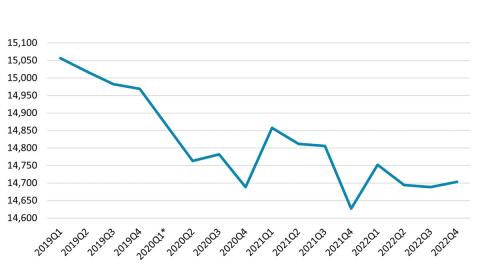
The number of nursing homes in the U.S. has been declining for a number of years, and some analysts have argued that this has contributed to delays in access to beds for hospitalized patients. This decline was exacerbated by the pandemic. In 2022Q4, there were 266 fewer nursing homes in the country than in 2019Q4, just before the pandemic began (Exhibit 1).
Exhibit 1. Number of Nursing Homes in the U.S.

Source: PBJ data
*Data not available for this quarter
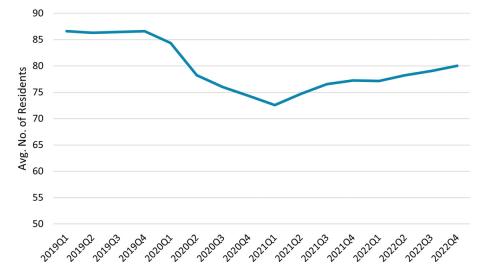
Over the same period, the average resident census in nursing homes also declined until 2021Q2, when it began to rebound somewhat (Exhibit 2).
Exhibit 2. Average Nursing Home Census
Source: Author’s analysis of PBJ data
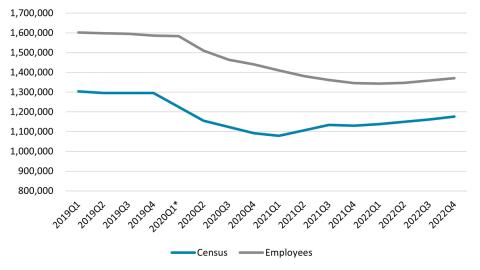
Like average census counts, the total number of residents in nursing homes also declined early in the pandemic and more recently has experienced a rebound. At the same time, the number of individuals employed in nursing homes also fell in early pandemic periods, followed by a partial recovery, albeit to a lesser degree (Exhibit 3). The decline in number of residents occurred more rapidly, though over a shorter period, than that of the workforce, reaching its minimum in 2021Q1, a full year before the number of jobs began its gradual recovery. By Q42022, the census was nearly 120,000 (10.2%) below its 2019Q4 level, while the size of the workforce was 216,000 (15.8%) below its pre-pandemic level.
Exhibit 3. Total Nursing Home Census and Size of the Nursing Home Workforce
Source: PBJ data and Altarum’s HSEI labor data
*Data not available for this quarter
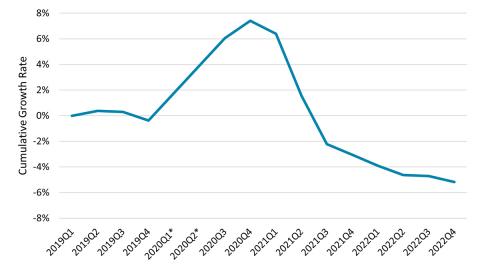
As a result, the number of nursing home employees per resident first grew to nearly 8% above pre-pandemic levels before falling to roughly 5% below pre-pandemic levels (Exhibit 4).
Exhibit 4. Overall Nursing Home Employment per Resident (Cumulative Growth Since 2019Q1)
Source: Author’s analysis of PBJ data and Altarum’s HSEI labor data
*Data not available for this quarter
The current levels of RN HPRD and NA HPRD provide measures of the adequacy of nursing home staff. With the staffing definition in use before 2021Q1, the overall NA HPRD rose slightly during the pandemic only to fall to 7% below its 2019Q4 level to 2.00 by the end of 2022. Even with the broader definition of HPRD used since 2021Q1, the average HPRD in 2022Q4, at 2.16, was only slightly above pre-pandemic levels that were based on the older definition (Exhibit 5). The overall RN direct care HPRD shows a similar pattern, rising somewhat during the pandemic, only to fall to 0.40 in 2022Q4, 5% below the 2019Q4 level. The RN total HPRD data are not available in the PBJ summaries prior to 2020Q3. However, in subsequent quarters, the average RN total HPRD also reached a peak of 0.69 in 2020Q4 before gradually dropping to 0.58 in 2022Q4. While these averages suggest that there is an adequate number of nurses to meet the proposed standard of 0.55 HPRD (if RNs in administrative positions are counted toward meeting the standard), the variation around the averages among nursing homes results in numerous nursing homes failing to meet the standard.
Exhibit 5. Average NA HPRD per Nursing Home
Source: Author’s analysis of PBJ data
*Data not available for this quarter
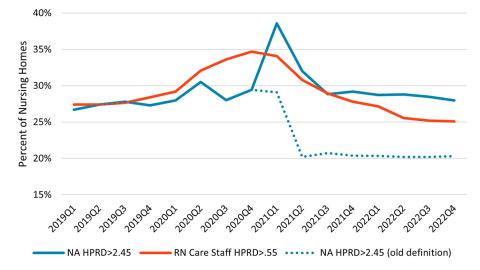
The percent of facilities that met or exceeded the proposed levels of 2.45 NA HPRD and 0.55 RN direct care HPRD is shown in Exhibit 6. The NA percentage peaked during 2021Q1, the same quarter in which both the total census and average census per facility reached their minima, while the RN percentage peaked in 2020Q4. Using the old definition for measuring NA HPRD, both percentages have subsequently fallen to rates below those before the pandemic began. As with the average staffing levels, the percent of nursing homes for which the RN total HPRD meets the 0.55 HPRD standard peaked at 62.6% in 2020Q4, subsequently dropping to 49.7% in 2022Q4.
Exhibit 6. Percent of Facilities Meeting Proposed HPRD Levels
Source: Author’s analysis of PBJ data
Increasing staffing to meet the proposed levels of 2.45 NA HPRD and 0.55 RN HPRD (using either of our two definitions for the latter) at all facilities would require a significant increase in nursing staff: CMS estimates a need for 12,639 additional RNs and 76,376 NAs.
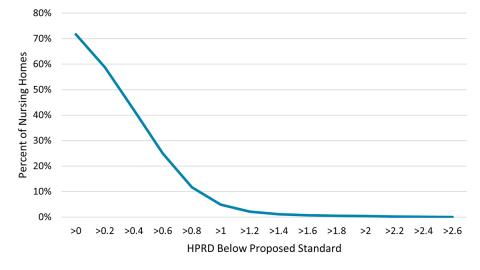
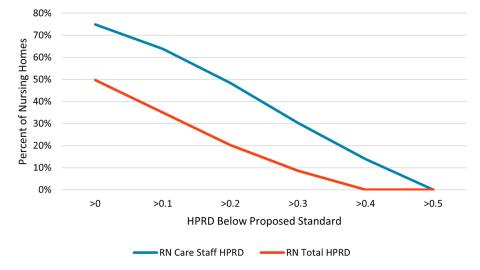
There is significant variation around these overall HPRD levels. Exhibits 7 and 8 depict the distribution of HPRD shortages across nursing homes in 2022Q4 for NAs and RNs, respectively. Each chart shows the cumulative percent of nursing homes as a function of the amount above which they fail to meet the proposed standards. For NAs, these shortages tend to be concentrated in lower values. While 71.8% of nursing homes fail to meet the 2.45 HPRD standard, only 4.9% are more than 1.0 HPRD below the standard. For RNs, 74.9% of homes fail to meet the standard if only direct care RNs are counted, and 49.7% fail to meet the standard if all RNs are included. These shortage levels are more evenly distributed among facilities than for NAs (Exhibit 8). For example, roughly the same number of nursing homes fall short of the RN standard by less than .1 HPRD as miss it within the same range of .1 and .2 HPRD. In contrast, more than 65% of homes miss the NA standard by less than 1 HPRD, while less than 5% miss it within the same range of 1 to 2 HPRD.
Exhibit 7. Distribution of NA HPRD Shortages among Nursing Homes (2022Q4)
Source: Author’s analysis of PBJ data
Exhibit 8. Distribution of RN HPRD Shortages among Nursing Homes (2022Q4)
Source: Author’s analysis of PBJ data
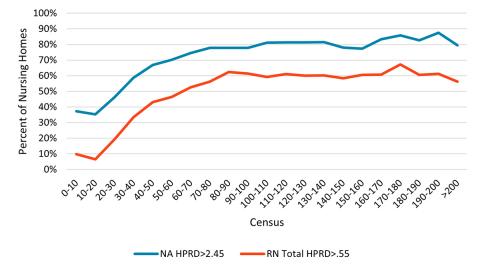
Failure to meet the proposed standards is correlated with nursing home census, with larger homes tending to more frequently fall below the standards than smaller homes (Exhibit 9).
Exhibit 9. Percent of Nursing Homes Failing to Meet Standards by Census (2022Q4)
Discussion
These results indicate that staffing levels per resident at nursing homes increased slightly during the pandemic, suggesting that, despite absolute declines in the number of staff, there was a temporary improvement in nursing home staffing rates. However, this appears to have been primarily the result of declines in staffing levels that lagged declines in the number of residents. As the impacts of the pandemic receded, staffing reverted to levels that were similar to or even below their pre-pandemic values.
The low staffing levels reported here are likely inadequate to provide safe, high-quality care. Achieving the newly proposed staffing standards would require a significant increase in the numbers of RNs and NAs employed by nursing homes and would be expected to increase the total costs required for nursing homes across the country, both through the need to pay additional staff and the higher wages that would likely be needed to attract them. CMS estimates that the economic impact of the staffing-related provisions of the proposed rule would average $4.06 billion per year for the first 10 years of implementation. It would also be likely that these increased costs would be met with increases in spending on nursing home care to account for these changes. While our most recent HSEI health spending data show that nursing home spending increased 11.5% year-over-year on average in the first six months of 2023 and is 22.0% higher in July 2023 than it was in December 2019, increasing staffing levels to meet the new requirements would require much faster overall spending growth. To the contrary, where such standards are not enacted with the resources required to meet them, the trends described in this paper suggest that extensive understaffing will likely continue.