Unpacking Spending Patterns: Prices and Utilization in Home Health and Nursing Home Care
September 11, 2024
Background
Our August 2024 HSEI spending brief indicated that spending on home health in June 2024 grew by 20.9% since June 2023, by far the largest growth rate observed among major spending categories. This spending growth was the largest since the spring of 2020, when government subsidies to combat the pandemic caused a major jump in spending. In June, the next largest spending category was nursing home care, which increased by 10.0% year over year. This trend is interesting given that home health and nursing home care are two ends of the spectrums of post-acute care and long-term services and supports.
To better understand the drivers of spending growth in these two categories, we utilize data used in our Health Sector Economic Indicators (HSEI) briefs to explore spending from all insurer types over the past two decades. First, we analyze total spending, and then examine the individual impacts of changes in prices and utilization on spending. Finally, we assess the per-capita spending growth in these areas to adjust for changes in the population over the last two decades. These figures demonstrate that the recent increase in spending on home health and nursing home care is part of a broader long-term trend, and the changes in prices and utilization that contribute to spending growth are distinct for these two types of services.
Methods and Results
Our definitions for nursing home and home health care are those used by the Centers for Medicare and Medicaid Services (CMS) in their National Health Expenditure Accounts. This definition of home health care may differ from the use of the term in other contexts; to avoid confusion with these alternative definitions, we use the term “home care” in this blog to represent CMS’ home health care spending category.
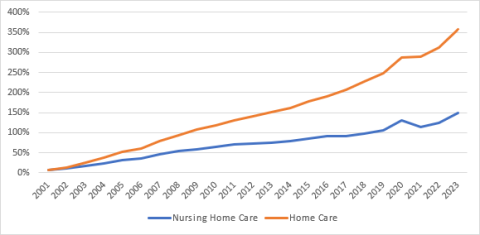
Looking at spending growth in the longer term, Exhibit 1 displays cumulative annual growth in spending on nursing home care and home care from 2000 to 2023. (The spikes in the curves in 2020 represent the impact of pandemic-related federal government subsidies.) During this period, spending on nursing homes grew by 148.7% while home care spending increased by 357.0%, a difference of 208.3 percentage points.
Exhibit 1. Growth in Spending on Home Care and Nursing Home Care Since 2000
Source: Data developed for Altarum’s HSEI spending brief for July 2024, based largely on CMS National Health
Expenditure data for 2000 through 2022 and BLS data for 2023.
These spending growth rates reflect increases in both utilization and prices. Our HSEI data indicate that, during this 23-year period, prices for nursing home care grew much faster (104.9%) than for home care (45.3%). To remove the effect of prices from the rates, we compute utilization growth (U) as spending growth (S) divided by price growth (P): U = S/P. Exhibit 2 shows the resultant growth in this implicit utilization for nursing home and home care from 2000 through 2023. By 2023, implicit utilization of home care grew by 214.5%, while nursing home utilization grew by 21.4%, a difference of 193.1 percentage points and suggesting a much faster growth in use of home care than nursing home care.
Exhibit 2. Implicit Growth in Utilization of Home Care and Nursing Home Care Since 2000
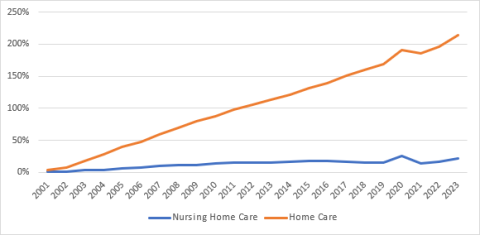
Source: Same source as Exhibit 1 plus data from Altarum’s HSEI price brief, using producer price index data from BLS.
Some of this utilization growth for both types of services is presumably due to an increase in the population needing these types of care. During this same period (since 2000), the U.S. population aged 65 and older has increased by 70%, though both nursing home and home care are also used by younger individuals. (In 2018, 83% of nursing home spending and 62% of home care spending was on behalf of individuals over the age of 65, according to CMS’ most recent data on spending by age.) To approximate (and remove) the effect of population growth on the changes in the use of both types of care, we computed spending growth per capita for the entire U.S. population and recomputed utilization growth using these per-capita spending values. Results are shown in Exhibit 3. The effect is somewhat lower growth in per-capita utilization of home care services (165.0%) and small growth in per-capita use of nursing home care (2.3%). Nursing home utilization growth has been mostly flat since 2000 and was 0.8% below the 2000 level in 2019, just before the jump in 2020 associated with pandemic-related federal government subsidies. It subsequently fell to -3.6% in 2021 before climbing slightly to 2.3% above the 2000 per-capita level in 2023.
Exhibit 3. Implicit Per-Capita Growth in Utilization of Home Care and Nursing Home Care Since 2000
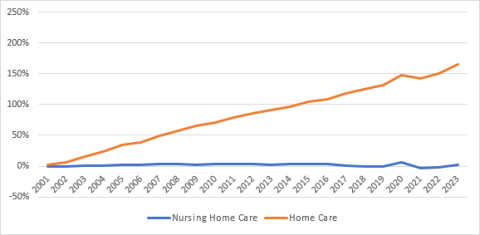
Source: Same sources as Exhibit 2 plus Census Bureau population estimates (for 2000 through 2022) and projections
(for 2023).
Discussion
We have shown that overall spending growth, overall utilization growth, and per-capita utilization growth since 2000 have all been considerably higher for home care than for nursing home care. Still, nursing home spending has continued to grow. Although the use of home care services grew almost 10 times faster than the use of nursing homes, nursing home prices increased twice as fast as home care prices during the same period.
A limitation of this analysis is that the data used do not allow separating utilization growth due to post-acute care from that associated with long-term services and supports. Subsequent analysis with other data, such as CMS’ breakout of spending by age and payer (currently available for years 2000 through 2020), could shed further light on these trends.