Utilization and Price Drivers of Increasing Health Care Spending (2010-2023)
June 10, 2024
Following the 2022 slowdown in health care spending that led to the overall health care sector reaching its smallest share of the economy since 2014 (17.3%), there has been a gradual resurgence in health care spending beginning in early 2023. This resurgence, driven predominantly by the greater use of care (and particularly a return of elective and outpatient services), is following the pandemic-affected period of very slow spending growth, postponed care, and health care labor shortages from 2020 through 2022. Higher utilization has been observed in data such as our monthly Altarum health care spending and prices briefs, as well as other industry sources such as hospital and insurer financial reports. In this blog, we put 2023’s above-average health care utilization increases into perspective historically and break down utilization trends by the different major health care spending categories.
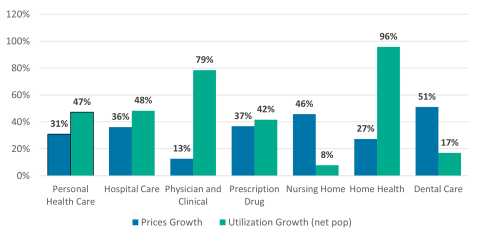
Over the past fifteen years, rising U.S. health care spending has been driven both by increased utilization and higher prices, with utilization increases contributing more to higher spending (Figure 1). Since 2010, utilization of personal health care (spending on health goods and services, excluding spending on program administration, net cost of insurance, public health activities, and investment) has increased 47% (contributing about 60% of the overall spending growth), while underlying prices for care have increased 31%. Greater utilization since 2010 has been affected by increases in overall population rates of health insurance coverage, an aging population, greater direct government support for health care during the pandemic, and increases in the intensity of care provided for many health care needs.
Figure 1: Cumulative growth in health care prices and utilization since 2010 (net of population growth), by sector
Source: Altarum Health Sector Economic Indicators data
Note: Utilization growth is calculated as the difference between overall health care spending growth and health care price growth. Utilization increases are shown net of overall U.S. population increases, but do not adjust for changes in age-sex population mix over time.
As seen in Figure 1 it is clear that these price and utilization increases have varied significantly across health care spending categories. Since 2010, utilization growth has significantly exceeded increases in health care prices for physician and clinical services and home health care, while price increases have been substantially greater than utilization growth for nursing home and dental care. For prescription drug spending and hospital care, price and utilization growth have been more evenly split since 2010.
Annual results over time (Figure 2), show the above-average increase in personal health care utilization in 2023 becomes more apparently. The 4.6% utilization growth in 2023 was the fastest observed since 2010 and was greater than overall health care price growth (2.9%) by 1.7 percentage points last year. While health care price growth has been rising since the start of the pandemic, it appears that utilization growth is beginning to overshadow price increases as the larger contributor to increasing health care expenditures. The 4.6% increase in utilization is even greater than the 4.0% growth seen in 2015 when the U.S. experienced a very large increase in health care coverage due to Affordable Care Act provisions, including Medicaid expansion.
Earlier in the data series, between 2010 and 2013, utilization growth for the combined set of personal health care products and services was much slower, while price growth remained below 2.0% year over year from 2013 until 2019. Due to increased economywide inflation pressures and higher health care wages, overall health care price growth increased in 2022 and 2023, with 2023 having both the fastest price growth and largest utilization increases in the data since 2010.
Figure 2: Annual year-over-year increases in personal health care prices, utilization, and population growth
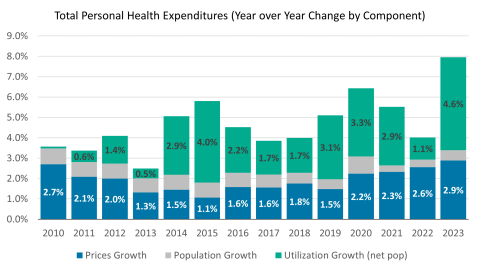
Source: Altarum Health Sector Economic Indicators data
However, the split between price and utilization factors of health spending growth over the past fifteen years has looked very different across health care spending categories. Figures 3 through 8 show the year-over-year trends in changes in prices and utilization across the major health care sectors: hospital care, physician and clinical services, prescription drugs, nursing home care, home health care, and dental care.
For hospital care (Figure 3), price growth between 2010 and 2023 has been slightly faster than overall personal health care price inflation, while utilization increases have looked similar to overall trends. Of note, utilization of hospital care actually declined slightly in 2022, before returning to 4.1% year-over-year growth in 2023. These hospital care trends can be contrasted with physician and clinical services, which have seen negligible price growth since 2010 (Figure 4), but much faster increases in the utilization of care. Particularly during the period from 2013 to 2019, physician and clinical care had basically flat overall price growth, but utilization increases that averaged around 4.0% per year. As a result, while cumulative spending increases since 2010 on hospital care (94%) and physician and clinical care (100%) are quite similar, the underlying components of these two growth rates vary significantly. Physician and clinical spending growth is nearly completely the result of increases in utilization, while price growth represents a major component of hospital care spending growth.
A related story is seen in comparing increases in spending for nursing home care versus home health care services between 2010 and 2023. While overall growth in home health care spending has been higher (Figure 6), utilization has played a much larger role in its spending growth compared to price inflation over this period. Prices for home health care have increased somewhat faster since 2018, but overall growth in utilization remains the dominant factor in its increasing spending. Conversely, for nursing home care, utilization increases between 2010 and 2023 were cumulatively basically flat, while prices increased significantly, particularly earlier in the data series, from 2010 to 2017. Since 2019, nursing home care price growth has been more moderate. It is important to note that the 2020 increase in utilization for nursing home care and home health occurred as a result of increases in temporary federal government support for these facilities that are included in spending and utilization data. By 2023, the majority of this temporary support had subsided.
Figure 7 and Figure 8 detail annual trends in dental care and prescription drug health care utilization and prices. Prior to the pandemic, dental care price and utilization increases were steady between 2010 and 2019, with moderate price increases year over year and mostly flat overall utilization growth. The pandemic dramatically affected this sector, and dental care had the largest drop in utilization in the first year of that pandemic (2020) of all the major sectors, but also a quick recovery in the following year. Between 2010 and 2023, prices for dental care have increased the most among all major health care sectors, up 51%. For prescription drugs from 2010 to 2018, price increases were the major contributor to overall spending growth, while utilization growth was mixed and often negative. However, since 2019, utilization increases have exceeded prescription drug price growth and utilization growth for drugs have been among the fastest of all the health care categories.
Because of the generally faster increases in utilization seen in 2023, health care payers, such as major insurers, are expected to be affected negatively in the short run, while providers will likely see increased revenues. The duration of this higher utilization trend is yet to be determined, as some of this greater use could be the result of residual pent-up demand from the pandemic and the recent health care labor shortages, indicating only a short-term increase in use. Yet, it is also possible broader demographic and health technology trends are driving higher use of care that could be expected to continue for some time. Prior research has noted the extent to which slower than expected health care spending growth over the past two decades, particularly for Medicare patients, has improved federal budget outlooks and health care cost burdens; yet, if the greater utilization of health care services alongside faster health care price inflation continues into future years, these savings could be short-lived. Our Health Sector Economic Indicator briefs will continue to track these price and utilization trends going forward.
Figure 3: Annual year-over-year increases in hospital care prices, utilization, and population growth
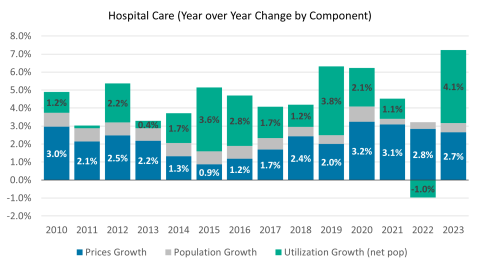
Source: Altarum Health Sector Economic Indicators data
Figure 4: Annual year-over-year increases in physician and clinical care prices, utilization, and population growth
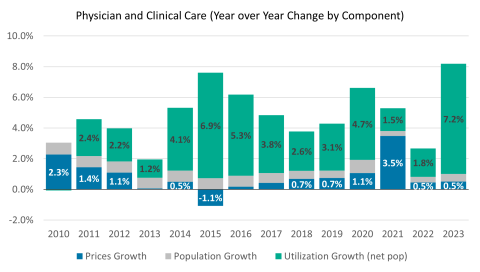
Source: Altarum Health Sector Economic Indicators data
Figure 5: Annual year-over-year increases in nursing home care prices, utilization, and population growth
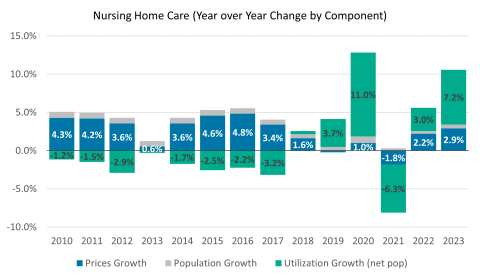
Source: Altarum Health Sector Economic Indicators data
Figure 6: Annual year-over-year increases in home health care prices, utilization, and population growth
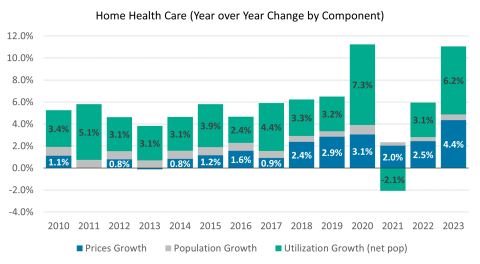
Source: Altarum Health Sector Economic Indicators data
Figure 7: Annual year-over-year increases in dental care prices, utilization, and population growth
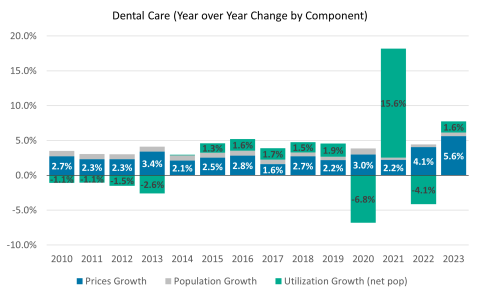
Source: Altarum Health Sector Economic Indicators data
Figure 8: Annual year-over-year increases in prescription drug prices, utilization, and population growth
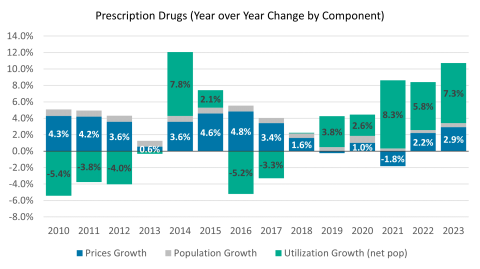
Source: Altarum Health Sector Economic Indicators data