Inflation-Adjusted Health Care Spending is Falling for the First Time in Half a Century
July 27, 2022
The confluence of a slower rebound in health care expenditures alongside rapid economywide inflation has resulted in a surprising reversal in health care’s real spending growth over the past year. While it is a notable decline for now, many of the drivers of this trend are expected to be short-lived.
In the sixty-year period from 1960—the first year tracked in the official CMS National Health Expenditure Accounts—to 2020, growth in national health spending has always been positive and greater than economywide inflation, leading to a continual increase in real or “inflation-adjusted” US health spending.*1 This has held true even in historical periods of very high US economic inflation, including the 1970s, meaning that health care’s overall cost burden has increased relative to consumer purchasing power and taken up a greater share of our nation’s GDP and household income.
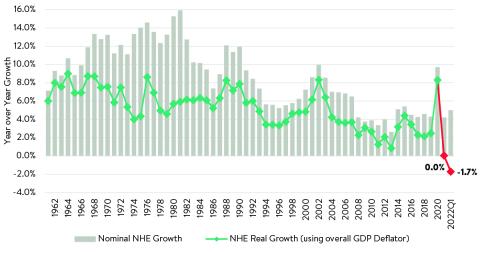
Yet, for the first time in 2021, real health care spending growth was flat, and in the first quarter of 2022, real health care spending actually declined by 1.7% year over year (Figure 1). This is seven full percentage points lower than the long-term average (+5.3%). As a result, we have also seen health spending decline as a percentage of US GDP (falling from a peak of over 20% in mid-2020 to 18.0% in May 2022) as overall US economic growth has rebounded much faster than health spending in the post-2020 period.
Figure 1: Real and Nominal Year-over-Year Growth in National Health Expenditures
Health care prices have grown much slower than inflation
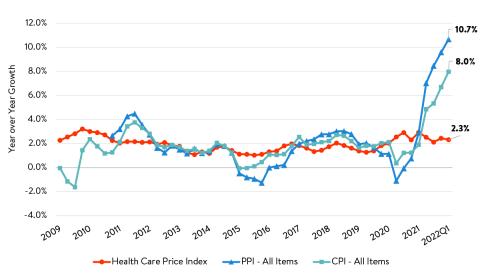
This decline in real health care spending is driven largely by a decline in health care price growth relative to economywide inflation (though slower utilization growth has also had an impact). Figure 2 shows the faster growth in economywide inflation as measured by the overall consumer price index (CPI) and producer price index (PPI) and the otherwise moderate increases in health care prices as measured by Altarum’s composite Health Care Price Index (HCPI). Beginning in Q2 2021, measures of economywide inflation increased rapidly, initially driven by increased prices for commodities such as cars and computer chips, then followed by a more moderate increase in economywide services prices in late 2021 and 2022. Yet, over this time health care price growth has stayed at or even fallen below its long-term average growth. This slow growth in health care prices has been a major factor in keeping overall health care spending under control relative to other economic components, and as we’ve recently discussed, is likely a result of delays in the contract negotiations and government policies that set health care prices in advance for future years. As 2022 prices for health care and services begin to reflect higher negotiated rates for care, we expect the health care price index to accelerate from its current growth rate.
Figure 2: Health Care Price Index (HCPI), CPI, and PPI Year-over-Year Growth
Health care spending as a share of personal consumption has declined
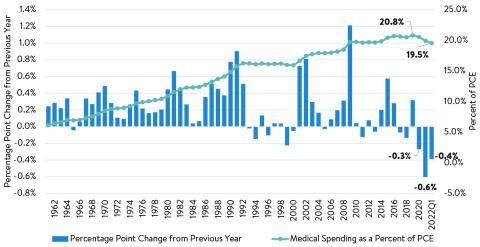
The decline in real health care spending is offering a bit of much needed respite to otherwise extremely tight consumer budgets in 2021 and 2022, when economywide inflation has made the costs of most other goods and services far more expensive due the combined rebound in overall demand following the COVID-19 pandemic and persistent supply and labor constraints on producers. When we measure the impact of health spending relative to total consumer personal consumption expenditures (PCE) tracked by the Bureau of Economic Analysis (BEA), we find that nominal medical spending as a percent of PCE has fallen since its peak of 20.8% in 2019 to 19.5% in Q1 2022 (Figure 3) and has undergone the greatest percentage point decline since 1960 for that series. We use nominal spending in our comparison of medical spending to PCE in Figure 3 because the denominator of total PCE is measured in the same dollars as medical spending in each year.
While the data above on inflation-adjusted health care spending showed that real health care spending growth was flat for the first time in 2021, the alternative measure of medical spending as a percent of PCE shows that health care costs as a portion of consumer expenditures peaked in 2019 and fell for the first time in 2020, a year before real health care spending shifted. Much of the difference between these two alternative measures is the large supplemental federal spending for health care providers and public health investments made in response to the COVID-19 pandemic. These federal expenditures are included in real health spending, but not in medical spending in the BEA’s PCE accounts, helping to explain why PCE’s medical spending proportion fell in 2020, while health spending saw a very large nominal increase.
Figure 3: Medical Spending as a Percentage of Personal Consumption Expenditures (PCE)
Health care costs as a share of household income has fallen
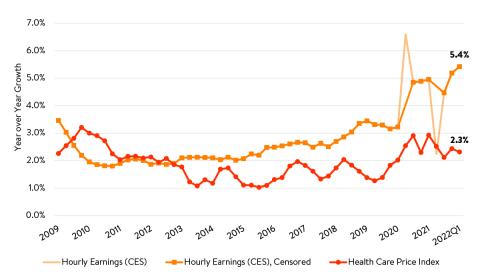
As an additional look at health care costs amongst household income and spending, we analyze the BLS Consumer Expenditure Survey (CEX), a more volatile, but household-level survey, and find evidence that relative health spending may have peaked even earlier than the PCE data indicate. In the CEX survey, health expenditures as a percent of overall household income actually peaked in 2017 at an average of 7.7% for all households and 9.4% for the twenty percent of households in the middle-income quintile. From that point on, CEX data show that consumer health expenditures have fallen in each of the next four years, reaching 6.9% of household income on average for all households in 2020 and 8.6% for the middle-income quintile households. Each of these represent a 0.8 percentage point decline in health care costs as a proportion of household income. As a result, we estimate that the median quintile of households spent $492 less in 2020 on medical care and health insurance premiums than they would have if the 2017 proportion of income had persisted. When looking at the detailed costs split between health insurance premium costs for households and out-of-pocket medical expenditures for the middle-income households, we see the decline in both categories since 2017, each falling by 0.4 percentage points. As a result of rising incomes and slow growth in health care prices and spending in 2021 (Figure 4), we expect the future release of CEX data will show a continued decline in consumer health spending as a percent of the total incomes in 2021 when it is released this fall.
Figure 4: Health Care Price Index (HCPI) and Hourly Earnings Year-over-Year Growth
A meaningful but likely temporary slowdown
Decreasing the long-term trajectory of health care spending in the US has been a longstanding goal of policymakers and business leaders, and these new data in some ways indicate a short period of success in this arena. However, despite indications of a slowing health care cost trend over the past 18 months, many of these impacts are expected to be short-lived. First, the data on health spending trends are still impacted by one-time federal health expenditure events, such as the Medicare Accelerated and Advance Payment programs. Some of the initial 2020 bump in health spending and subsequent year-over-year declines are artificially driven by one-time injections of cash (and the subsequent return of advance payments*2) that occurred during the pandemic for health care and public health. A return to more normal federal spending patterns may cause health expenditure growth rates to return to long-term trends.
Second, we expect that this period of very low health price growth may come to an end as new provider contracts come into effect in 2022. In the July 2022 edition of our Health Sector Indicator Briefs, we note that private insurance price growth for health services jumped by 3.9% year over year, the highest level since 2014, likely portending an upcoming period of above average health price inflation. Furthermore, there is evidence in early marketplace rate filings that 2023 will be a time of above average health care price growth and that the wider economic inflation may no longer exceed growth in health care prices. This would drive nominal and real health care spending growth back towards the positive. The extent to which private price growth will pull total health expenditures significantly higher in the rest of 2022 and 2023 remains to be seen, as a countervailing force of lower Medicare hospital and physician reimbursements is also in place. Regardless, we expect that when final CMS national health expenditure data are released for 2021 and 2022 that they will likely show a meaningful dip in the real long-term health care cost trend, at least temporarily alleviating some of the spending pressures that occurred in 2020 due to the COVID-19 pandemic.
*1 Following suggestions of BEA and AHRQ experts in Dunn, Grosse, and Zuvekas (2018), we compute real health care spending by adjusting nominal expenditures with the GDP implicit price deflator, since our purpose in this piece is to address changes in health spending in terms of overall consumer purchasing power.
*2 See for example, commentary from CBO in their annual review of the 2021 fiscal year, where Medicare spending declined by over 10% relative to 2020 levels.